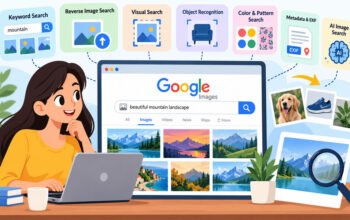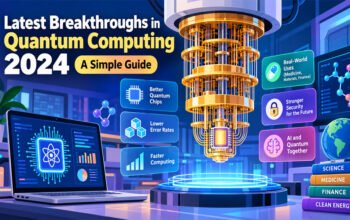
We’re in the Information Age in which there’s a lot of information and not enough attention. The moment you wake up, you are flooded with all sorts of text, data and noise. The struggle to get information out to users is not the problem anymore, it’s how information is consumed, understood, and remembered. That’s where visual communication can come in handy. While words can be boring and hard to swallow, words and design together can inform and amuse. The best way to do this is via infographics, otherwise known as a pictorial explanation of information, data or knowledge designed to communicate complex information in a quick and easy-to-understand way.
Understanding the Psychology of Visual Content
It’s important to first consider the reasons behind the effectiveness of visuals, before entering into the technical aspects of design. Images are 60,000 times faster to be processed by the human brain than text. In addition, 90% of all information that reaches the brain is sight related. In reading a text block, we are employing the capacity of our cognitive processes to decode symbols and string them together to make sense of them. When creating infographics, you should choose a color palette that aligns with your brand identity and the tone of the content. We can easily understand a graph, a diagram or an illustration. The number one guideline for infographics is to convey your single message.Creating an infographic is based on the premise that you’re trying to communicate one thing. The brain is more likely to process visual information than any other type of information; so the less cognitively demanding it is to understand your message, more people will hear your message and remember it.
The Blueprint: Planning your Visual Guide
All good designs begin with a good plan. Without a strategy, you will probably end up with a jumbled mess, that will only confuse but not clarify. Need to share complex information, compare two products or report survey results? So, if the goal is set, it is imperative that you know your audience. The guides will be very different, depending on the age of the students.A guide for elementary school students will be very different from a guide for data scientists. The best infographic is one that provides good information. Use reliable and valid sources, and verify the statistical information. With your raw data in hand, it is now time to put them into a storytelling format. Finally, a good infographic will have a beginning, a middle, and an end it will tell a story: the introduction of the problem, the data or process, and the conclusion or solution. This storyline allows the viewer to ‘travel’ through the design.
The structure and design of the space
A common design blunder is not to create a visual hierarchy. When all of your design is large and prominent, there is nothing prominent, which is what you didn’t want. The Order of elements in the way that it is arranged to show importance is the concept of Visual hierarchy. It dictates the order of the eye of the human in seeing what it sees. The effectiveness of a well-designed infographic is based on its ability to guide the reader from the headline to the main data elements to the supporting information elements through size, color and contrast. Note that there are two patterns to think of when designing your layout: “Z-pattern” or “F-pattern” of the reading. The majority of western readers start reading at the top left and work their way around to the bottom right. The most important information should be at the top of the screen, as the first place that the eye goes. Use whitespace effectively.
Colour and typography combined are a very strong element
Colour is not only for decoration, it is a means of communication. Colors vary and say different things evoke different emotions. Blue denotes trust and professionalism, green is for health and growth and red for urgency and passion. Color palette should be considered in creating infographics which should be consistent with one’s brand and the tone in the content. Keep it more cohesive with no more than 3 colour primary colours. You should also be using typography – it is very important! The overall font you use will be a part of the whole and will set the tone for the whole. Serif font can lend a more traditional and authoritative appearance while sans-serif font can bring a more modern and clean appearance to the table. Please ensure that your font size will be big enough to be readable on mobile devices otherwise many will be reading your content guides on their mobile device. The prime rule of typography is, “Be legible, period.The rule of typography is: “Be legible, period.
Data Visualization: Numbers Talk
Many infographics are based on data visualisation. This is where you will find raw data and how to turn them into charts, graphs and maps. The key in visualizing data is that it must be easy. The most important thing about visualizing data is that it should be simple. Try not to use 3D charts, too many grid lines or labels that aren’t needed. A pie chart has no more than five “slices.It is generally not desirable to have a pie chart with more than 5 “slices”. The aim is to provide a comparison and contrast of the data. Always ask yourself, when making an infographic, whether the type of chart you selected is the appropriate chart for the data that you have. Line graphs are suited to display changes over time, for instance, and bar charts for comparisons between quantities of categories, for example.
Tools of the Trade
Even though you may not be a professional graphic designer to make great infographics. The process is accessible to all with a number of tools available. Thousands of templates are available for you to customize with your information and branding in Canva, Piktochart and Venngage. In more complicated data visualizations, you may need to use a tool such as Tableau and/or Adobe Illustrator. The type of tool used will vary based upon the complexity of the design and the skill level of the person using the tool. The tool, however, is a tool and the strategy and content are what count.
Conclusion
With the world becoming a more visual place, it will have more uses to be able to break down information into an easy-to-consume graphic. It’s not only about making something pretty that makes it an informative visual content guide; it’s about making it clear. It’s about respecting time and brainpower of your audience. Creating infographics enables you to give your audience the ability to learn, understand and act. The infographic is one of your most valuable weapons whether you are a marketer trying to sell a product, a teacher trying to explain a concept or a journalist reporting the news. Make your plan clear, stick to the story, think creatively and make purposeful designs and you will produce visual content that really educates and inspires.